Which Country Has The Cheapest LEGO?
Have you ever wondered if your country gets a “square deal” when it comes to LEGO prices? Well, you’re in luck! Today we’ve crunched the numbers and can present a comparison of prices across 22 countries spanning Europe, North America, and Australia.
Let’s not mess about with the preamble and get straight to the results.
Australia Has the Cheapest LEGO… Barely
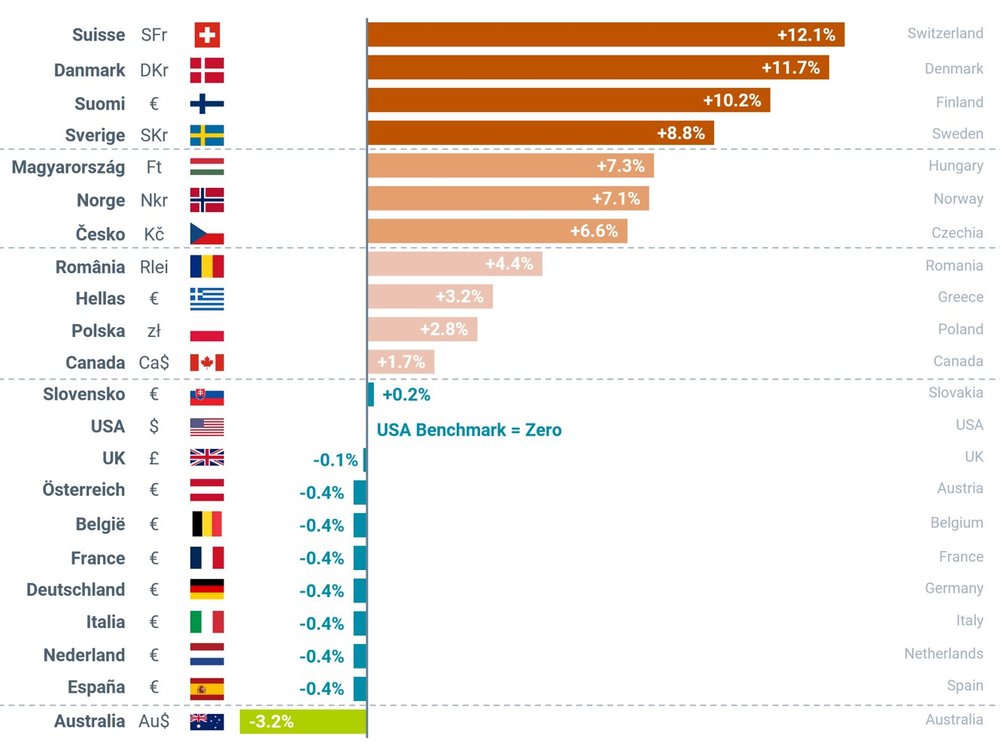
Using MRSP / RRP data from Brickset, we found that Australia was the most affordable among 22 countries for buying new LEGO sets. On average, Australian residents pay -2.7% less than the benchmark country, The United States.
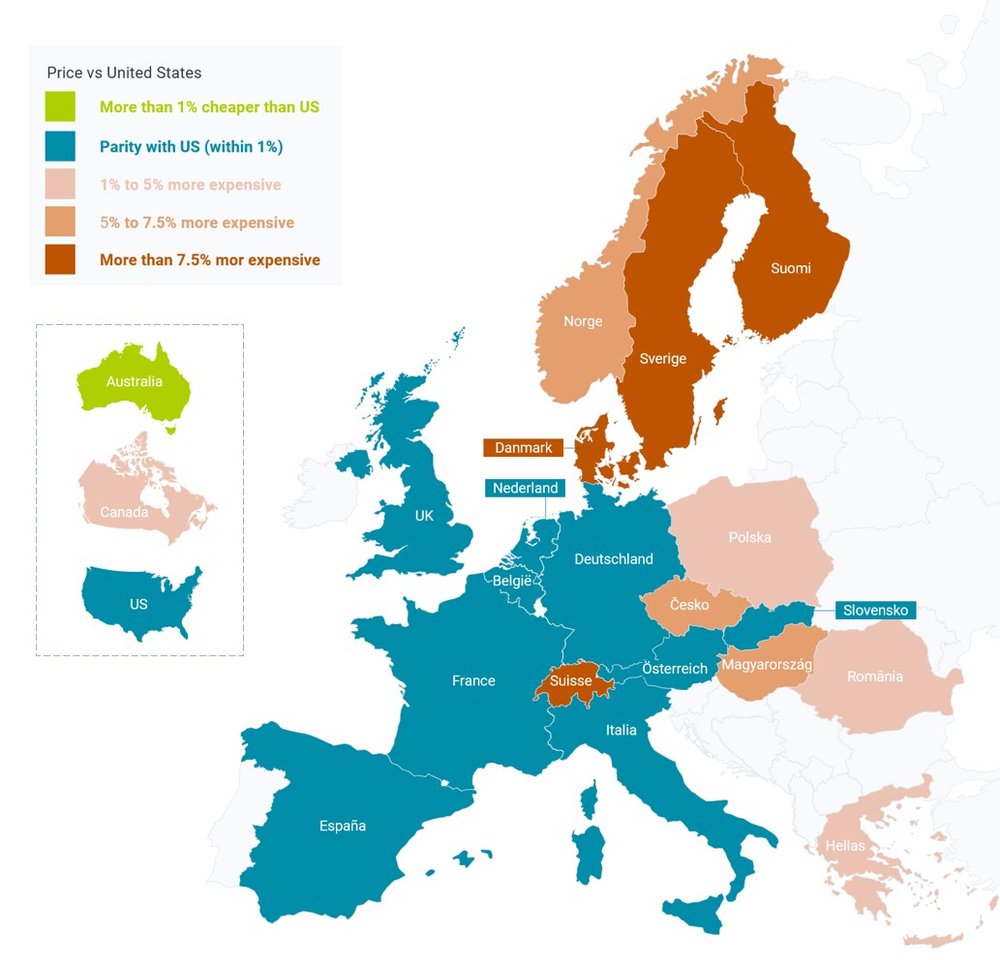
Price by County versus The United States
Map sourced from Envato Elements under Licence
Switzerland was the most expensive nation, with prices +12.1% higher than the US. They were closely followed by the Nordic countries Denmark (+11.7%), Finland (+10.2%), Sweden (+8.8%), and Norway (+7.1%), as well as Hungary (+7.3%), and Czechia (+6.6%).
Price Parity Across The LEGO Group’s Largest Markets
Prices across The LEGO Group’s major markets are remarkably similar, with The United States and the largest countries in Western Europe all priced within 1% of each other. Austria, Belgium, France, Germany, Italy, Netherlands, and Spain all share the Euro, and prices are uniform across this group. This broad group of countries is lock-step in line with United States prices, as are The UK and Slovakia.
Increase in prices by country (Benchmark USA)
How We Calculated These Numbers
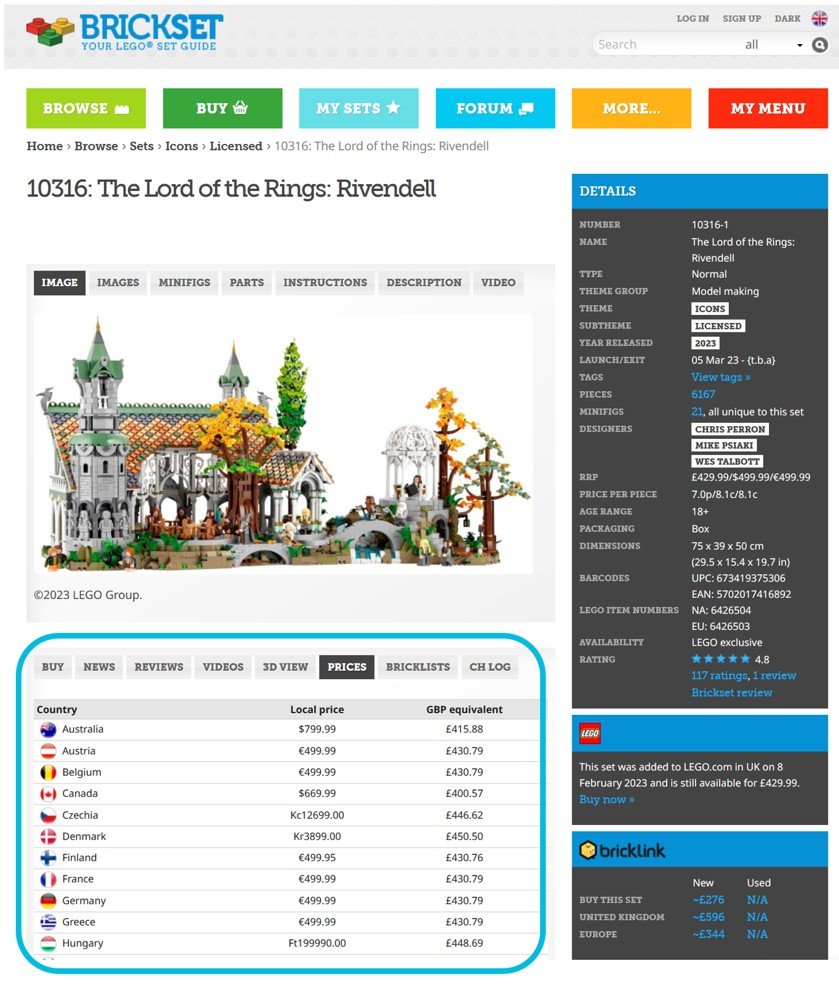
Brickset Retail Prices
Before hopping into the comments and sharing why we are possibly wrong, let’s take a look at the numbers and reasoning. I obtained the manufacturer’s suggested retail price (MSRP, often quoted as RRP, SRP, or MRP) from Brickset for each of the 50 largest sets of the year so far.
I chose the United States as the “reference country,” meaning prices in local currencies, such as The Euro, have been converted into US$, and any percentage differences in prices are in reference to the US benchmark price. These prices are original MSRP from LEGO and do not consider third-party retailer discounts.
Exchange Rates
Exchange rates have a significant impact on the results, and to mitigate them as much as possible, I’ve used an average rate for 2023 rather than a spot rate. For example, at least part of the reason Australia appears the cheapest is due to the Australian Dollar’s increasing strength against the US Dollar.
Given both the closeness of the results, and their sensitivity to changing exchange rates, the outcome above is unlikely to be exactly the same in 12 months time.

Image via LEGO . 75367 Venator-Class Republic Attack CruiseR
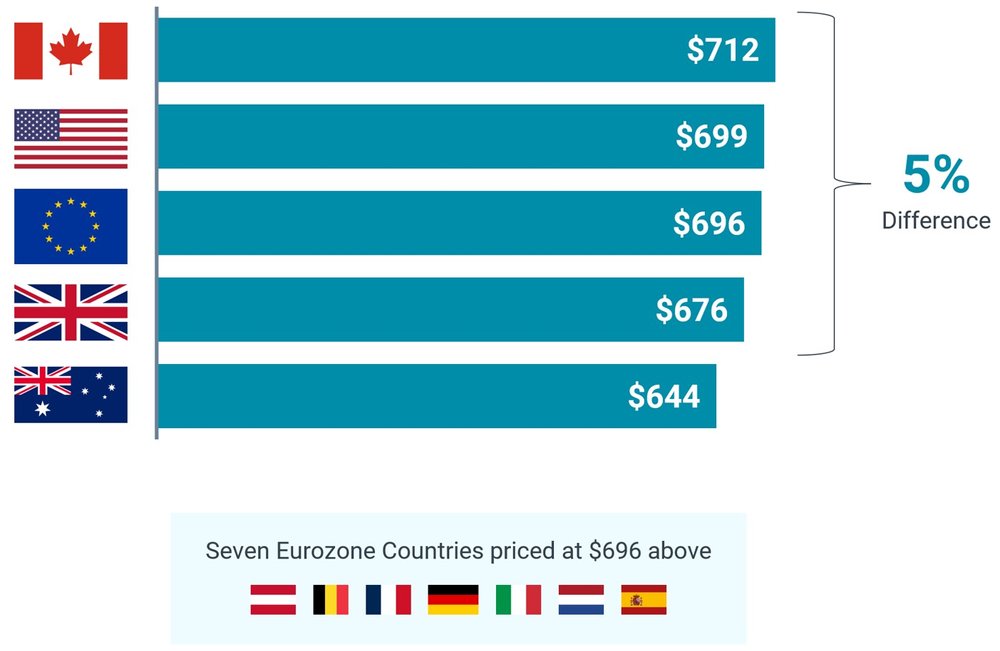
Using an illustrated example, the prices for the soon-to-be-released 75367 Venator-Class Republic Attack CruiseR are separated by 5% in the United States, Canada, the UK, and EU-Seven. Australia is the cheapest again, but I think it is just as likely the results could be reversed for future releases, depending on the prevailing exchange rate at the point The LEGO Group “locks in” the final retail prices.
MRSP / RRP Prices for 75367 Venator Cruiser converted into US Dollars
Sales Tax and VAT
LEGO.com prices in the United States and Canada are listed prior to the addition of federal, state, and local taxes (perhaps part of the reason the US and Canada are perceived as cheaper within the LEGO community). Combined sales taxes in the US range between 0% (e.g. Oregon) to up to 9% (e.g. Washington), making some states much cheaper than others to purchase goods. To account for this, I’ve applied a 7.5% sales tax to the US listed prices, which is an average rate weighted by state population. For Canada, I’ve used an identical approach to generate a combined rate of 12.4% to cover GST, PST, HST, and QST.
It is perhaps expected that Nordic countries are some of the most expensive places to purchase LEGO. Their political systems lean towards higher taxes to support many public services. An example is the c.25% VAT rates in Scandinavia compared to c.20% in Germany, France, and The UK.

Image sourced from Envato Elements under Licence
Other Factors
Exchange rates and sales taxes have the biggest impact on price, but other factors in different jurisdictions can increase costs including labour costs, proximity to manufacturing, consumer purchasing power (Switzerland), and inflation. All these factors should be taken into account when interpreting the results.
Why Only 22 Countries?
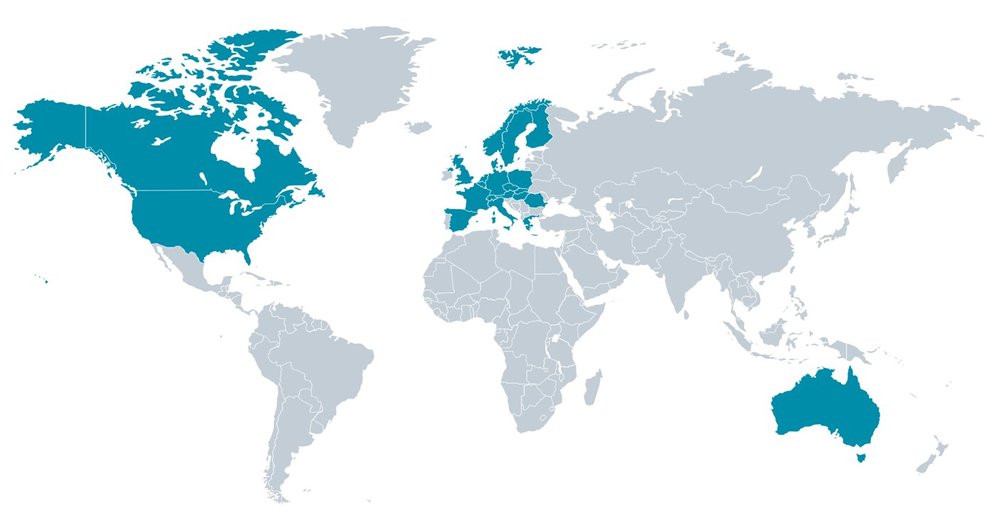
Pricing data from Brickset was available for 22 countries including Australia, Canada, The United States, and most European nations, representing 900m people, and half of the world’s gross domestic product (GDP).
Regretfully, data for other major territories wasn’t easy to obtain and in fact, if it was not for Brickset having its comprehensive database of prices, this article would not have been possible at all. Given this skewed sample, we should be conscious that the terms “cheapest” and “most expensive” only apply to this group.
22 Countries included in the Sample
Map sourced from Envato Elements under Licence
Conclusions
The biggest takeaway for me by far is the consistency of prices across the largest markets. I anticipated much more variation, especially between North America and the European nations.
Even in the countries where there are larger differences, these are usually driven by factors specific to that territory, such as taxes noted above. One might expect that if LEGO is expensive in Switzerland, so too will Barbie, Pokémon Cards, and Goo Jit Zu action figures be expensive. Although we can’t know for certain, this indicates The LEGO Group wants to maintain prices as consistent as possible across their key markets (at least from the macro level—individual set prices can still vary).
So congratulations to Australia, not only on retaining The Ashes (with some “choice” wicket keeper decisions may I add), but more importantly, as being the cheapest place to buy LEGO in the “Western World”. Well played!
Sources and Methodology
Sample – 50 largest sets based on piece count. Five BrickLink AFOL designer sets were excluded due to lack of price data.
Local currency prices sourced from Brickset.
Exchange rates sourced from Yahoo Finance.
MSRP conversations from local currency to US Dollars was done using the average exchange rate between 1 January and 19 September 2023. Other approaches are valid, such as the exchange rate on the day of release, but this adds more variability if the spot rate on that day is significantly higher or lower than the average.
An average sales tax rate has been calculated for both Canada and The United States based on a state by state population weighted average.
US sales taxes sourced from taxfoundation.org.
Canada sales taxes sourced from the Government of Canada.
Population figures sourced from Wikipedia (yes, I know, but sometimes it just does the job nice and quick).
Correction - Finland was included as a “Scandinavian” country, rather than “Nordic”. Scandinavia traditionally refers to Denmark, Norway, and Sweden.
Have you ever crossed a national border to purchase LEGO? Leave your thoughts in the comments below.
Do you want to help BrickNerd continue publishing articles like this one? Become a top patron like Charlie Stephens, Marc & Liz Puleo, Paige Mueller, Rob Klingberg from Brickstuff, John & Joshua Hanlon from Beyond the Brick, Megan Lum, Andy Price, Lukas Kurth from StoneWars, Wayne Tyler, LeAnna Taylor, Monica Innis, and Dan Church to show your support, get early access, exclusive swag and more.


